Get to know America's midsize cities
Here at the Metro Ideas Project we are really into cities. We’re fascinated in everything from the way they’re designed to how they choose to govern themselves. Particularly, we focus on midsize cities across the country. So it was only natural that in launching this project, we took some time to get to know those places a little bit better.
To start our comparative analysis, we needed what any good researcher needs: data. It turned out that comparing cities to each other using the same dataset wasn’t as simple as we originally had thought. A lot of federal data is sorted by census tracts or counties as opposed to individual cities or municipalities. But it turned out that the U.S. Census Bureau had exactly what we needed in the American Community Survey.
The ACS is a national annual survey conducted by the U.S. Census Bureau and the primary source for estimates of national population characteristics. It’s a key data source for policymakers, planners and the public seeking to understand economic and social trends at the national, regional, state and local levels. To better understand why we chose the ACS as our data source, it helps to first understand some things about the census.
How does the U.S. census work?
The decennial census, conducted every year ending in a zero, traditionally included two different surveys: the short form and the long form. In 2010 the short form covered 10 basic questions to gauge the American population’s gender, racial and age compositions, count and rate of home ownership. Approximately 74 percent of households returned the short-form version of the 2010 census.
In contrast to the short-form questionnaire, the long form was given to a smaller sample of the total population. One in six households received the long-form questionnaire in 2000. The long form covered the basic census questions plus more detailed questions on a broad range of subjects, such as educational attainment, income and occupation. Since 2010, the ACS has replaced the decennial long-form census.
What’s the difference between the U.S. census and the ACS?
The ACS is different from the long-form census in a few important ways. The first is that the ACS is conducted every year, which means that data is more current. Data is also collected nearly every day over the course of 12 months, rather than one snapshot in time. The ACS, however, covers a smaller portion of households – roughly 1 in 40 households, or 3 million addresses. Since the sample population is smaller, the Census Bureau releases yearly estimates as well as aggregate three- and five-year estimates, which have larger sample sizes 1. For all these reasons, the ACS is a good source to compare our target cities, and it will serve as the basis for a number of our national studies in the future.
Where we find midsize cities
We define midsize cities as having between 75,000 and 500,000 people. According to the 2014 one-year ACS population estimates, this includes 441 cities in 45 states (sorry Delaware, Maine, Vermont, West Virginia and Wyoming). California is home to the most midsize cities with 110. It is distantly followed by Texas with 42.
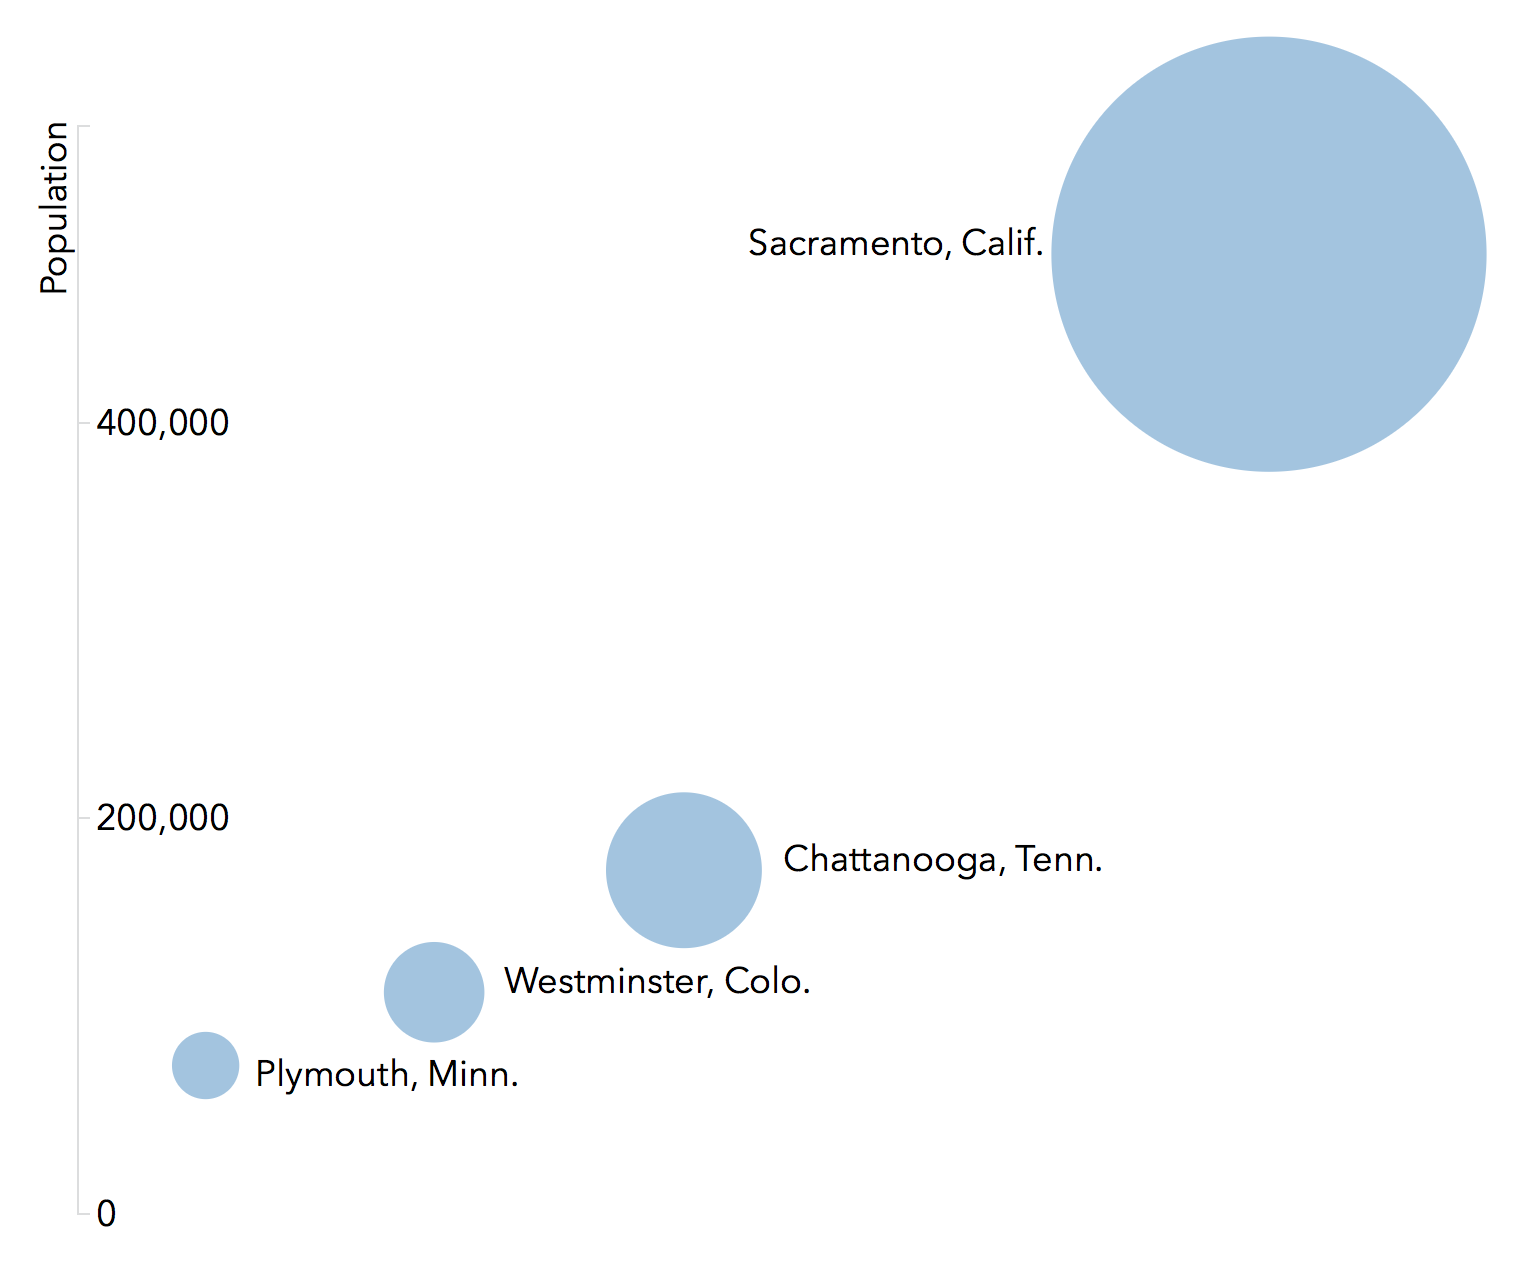
The total number of residents across all 441 cities is roughly equal to 64 million, or 20 percent of the total U.S. population. The smallest city in our range is Plymouth, Minnesota, with a population of 75,065. The largest is Sacramento, California, with 485,193 residents. The median city of Westminster, Colorado, has a population of 112,099.
What’s average anyhow?
When looking across all 441 midsize cities, we can describe what the average American city might look like and some of the notable outliers 2.
Age: 35
The median age for all cities is 35. The city with the lowest median age of 22 is College Station, Texas, home to Texas A&M University. The city with the highest median age, 49, is Largo, Florida.
Marriage rate: 40 percent
Forty percent of people in midsize cities are married. This is compared to a national average of 50 percent. The proportion of married people in our cities ranges from 62 percent to 23 percent. The city with the highest proportion is Fremont, California. The lowest is Rochester, New York.
Divorce rate: 12 percent
You know that oft-repeated bummer of a statistic saying half of all marriages end in divorce? Well, here’s some good news for the romantics out there: that hasn’t been true for over four decades now. According to the ACS, only 12 percent of the surveyed population in midsize cities reports being divorced. This is slightly lower than the national average of 14 percent. The city with the lowest divorce rate of 7 percent is Fremont, California, which also has the highest marriage rate. (There must be something special about the people of Fremont!) The city with the highest divorce rate is Reno, Nevada, at 16 percent.
Population with a bachelor’s degree: 32 percent
Thirty-two percent of residents in midsize cities have earned a bachelor’s degree or higher. The smartest city in our study is Cambridge, Massachusetts, where 75 percent of the population has a bachelor’s degree.
Median earnings with no high school diploma: $20,547
Median earnings with a high school diploma: $26,774
Median earnings with a bachelor’s degree: $47,221
Education makes a difference. Workers with a high school degree earn about 30 percent more than workers without a degree — a difference of $6,227 per year. Workers with a bachelor’s degree earn 76 percent more than workers with only a high school degree — a difference of $20,447 per year.
Poverty rate: 18 percent
Poverty rate for men: 16 percent
Poverty rate for women: 19 percent
The average poverty rate across all cities is 18 percent. Women reported a higher rate of poverty than men in 86 percent of the cities. The city with the lowest estimated poverty rate of 2 percent is San Ramon, California, a suburb of San Francisco. The city with the highest estimated rate, 40 percent, is Flint, Michigan.
Vacant housing: 10 percent
Owner occupied housing: 53 percent
Renter occupied housing: 47 percent
Ten percent of housing is vacant across our study cities. It’s hardest to find a place to live if you’re in Meridian, Idaho, which only has 0.7 percent vacancy. You should have an easier time if you’re in Miami Beach, Florida, where 39 percent of housing is vacant. The highest percentage of homeowners is located in Sugar Land, Texas, at 87 percent. The highest percentage of renters is located in Hawthorne, California, at 79 percent.
Why does any of this matter?
If this leaves you with more questions than answers, you aren’t the only one. This is the starting point in a conversation about cities and what makes them unique and what binds them together. In the months and years ahead, we will explore the implications of public policy through data-driven research and how those policies impact our everyday lives.
There is a fundamental curiosity that drives our work, from the seriously tough issues facing communities nationwide (e.g. how do we build a better education system that is equitable for kids of all income levels and races) to the occasional quirky thought (e.g. what makes people more likely to get and stay married in some cities compared to others).
We hope you are as compelled by these curiosities as we are. We are going to be asking big questions, but we may not always find satisfying answers. But in that pursuit itself, we believe communities grow stronger, healthier and more democratic. We are excited to start this dialog in cities and places across the country.
Footnotes

Jacqueline Homann
Jacqueline Homann has worked at a number of international and federal institutions. She is a graduate of the LBJ School of Public Affairs at the University of Texas at Austin and holds an M.A. in policy studies.